About the indicator
Sulphur dioxide, or SO2, is an air pollutant that can have negative effects on human and ecosystem health. Exposure to SO2 can result in respiratory health problems. SO2 can also negatively affect vegetation when deposited onto plants or surrounding surfaces and can contribute to acidic deposition, commonly known as acid rain.
This indicator reports on the concentration of SO2 from 2000 to 2023 and provides information on the variation across Alberta and how concentrations have changed over time. This indicator also compares SO2 concentrations with Alberta’s Ambient Air Quality Objectives (AAAQOs), which set thresholds for air pollutants to protect human and ecosystem health.
Sulphur dioxide facts
- The major sources of SO2 in Alberta are primarily industrial sources, such as the extraction and processing of oil and gas and power generation.
- SO2 emissions can also lead to the formation of other air pollutants such as fine particulate matter.
Methods
For information on how the results in this indicator were calculated and for references, see: Condition of the Environment Report – Air Component
Summary of key results
Last updated: February 2025
- SO2 concentrations have been decreasing throughout much of the province over the past 2 decades, due to improved emissions control technology and practices at industrial facilities. Recent examples include the phase-out of coal-powered electricity, efforts to reduce flaring and venting, and required increases to sulphur recovery and removal from industrial emissions.
- Over the past 2 decades, annual average concentrations of SO2 were well below the annual AAAQO throughout Alberta. Historically, exceedances of the one-hour AAAQO have occurred at stations near industrial facilities.
- The highest concentrations of SO2 in Alberta are found near large industrial facilities.
Variation across Alberta
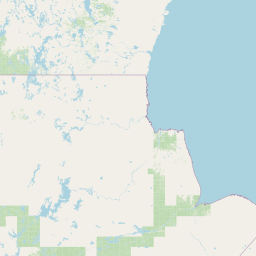
- Concentrations of SO2 are higher near major industrial sources such as in Alberta’s oil sands region and the industrial heartland northeast of Edmonton (Figures 1a and 1b).
Figure 1a. Annual average SO2 concentrations across Alberta for 2023
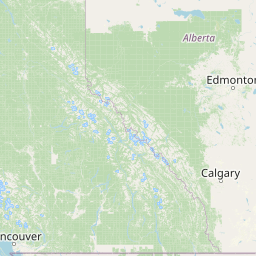
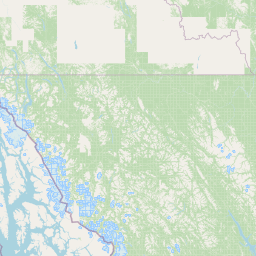

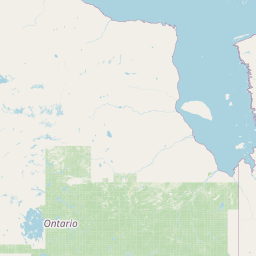

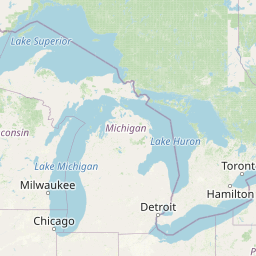
Select a circle on the map to view the 2023 concentration and the 10-year trend in monthly average concentrations for a specific monitoring station.
Source: Government of Alberta
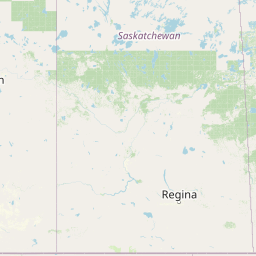
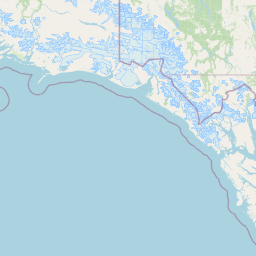
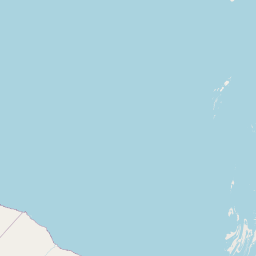
Figure 1b. Peak SO2 concentrations across Alberta for 2023
Select a circle on the map to view the 2023 concentration and the 10-year trend in monthly average concentrations for a specific monitoring station. Peak concentrations are calculated as the annual 99th percentile of daily maximum concentrations.
Source: Government of Alberta
Changes over time
- Between 2000 and 2023, Alberta saw a statistically significant decrease of annual average and peak concentrations of SO2 when averaged across all monitoring stations (Figures 2a and 2b, respectively). This trend is consistent with trends across Canada as technology improves for removal of SO2 from industrial emissions sources.
- Edmonton and Calgary saw statistically significant decreasing trends in annual average SO2 concentrations. Other major population centres (Fort McMurray, Grande Prairie, Lethbridge, Medicine Hat and Red Deer) saw no statistically significant trends in annual average SO2.
- Peak SO2 concentrations also decreased in Calgary and Fort McMurray. This decrease was statistically significant. No statistically significant trend in peak SO2 was detected for other major population centres in Alberta.
Figure 2a. Trends in annual average SO2 concentrations from 2000 to 2023 at large population centres in Alberta
Chart data table
| Year | Provincial Average | 10th Percentile | 90th Percentile | Calgary | Edmonton | Fort McMurray | Grande Prairie | Lethbridge | Medicine Hat | Red Deer | AAAQO |
|---|---|---|---|---|---|---|---|---|---|---|---|
| 2000 | 1.3 | 0.6 | 2.3 | 2.9 | 2.4 | 0.9 | 0.7 | 8 | |||
| 2001 | 1.2 | 0.3 | 2.5 | 3 | 2.3 | 1 | 0.5 | 8 | |||
| 2002 | 1.3 | 0.4 | 2.2 | 2.2 | 1.8 | 1.3 | 0.5 | 8 | |||
| 2003 | 1.4 | 0.5 | 2.4 | 2.1 | 1.3 | 1 | 0.5 | 8 | |||
| 2004 | 1.4 | 0.5 | 2.5 | 1.6 | 1.3 | 1.2 | 0.6 | 0.4 | 8 | ||
| 2005 | 1.3 | 0.4 | 2.2 | 1.7 | 1.6 | 1 | 0.5 | 0.4 | 0.5 | 8 | |
| 2006 | 1.2 | 0.4 | 2.5 | 1.4 | 1.3 | 0.8 | 0.6 | 0.2 | 0.4 | 8 | |
| 2007 | 1 | 0.4 | 2.1 | 1.1 | 1.4 | 1 | 0.4 | 0.1 | 0.5 | 8 | |
| 2008 | 1 | 0.3 | 1.9 | 1.2 | 1.1 | 0.9 | 0.3 | 0.2 | 0.4 | 8 | |
| 2009 | 0.9 | 0.3 | 1.8 | 1.2 | 1.1 | 1 | 0.4 | 0.2 | 0.4 | 8 | |
| 2010 | 0.8 | 0.2 | 1.4 | 1 | 1 | 0.8 | 0.4 | 0.1 | 0.5 | 8 | |
| 2011 | 0.8 | 0.2 | 1.6 | 1 | 0.8 | 0.3 | 0.1 | 0.4 | 8 | ||
| 2012 | 0.7 | 0.2 | 1.3 | 0.8 | 0.5 | 0.3 | 0.2 | 0.1 | 0.2 | 8 | |
| 2013 | 0.8 | 0.2 | 1.3 | 1 | 0.8 | 0.2 | 0.3 | 0.1 | 0 | 8 | |
| 2014 | 0.8 | 0.2 | 1.4 | 1.1 | 0.9 | 0.2 | 0.4 | 0.1 | 0 | 8 | |
| 2015 | 0.7 | 0.1 | 1.1 | 0.3 | 0.9 | 0.9 | 0.1 | 0.4 | 0.1 | 0.1 | 8 |
| 2016 | 0.7 | 0.1 | 1.3 | 0.3 | 0.8 | 0.9 | 0.1 | 0 | 0.1 | 0.1 | 8 |
| 2017 | 0.6 | 0.1 | 1.1 | 0.3 | 0.9 | 0.6 | 0.2 | 0 | 0.1 | 0.2 | 8 |
| 2018 | 0.5 | 0.1 | 1 | 0.4 | 0.9 | 0.6 | 0.4 | 0 | 0.1 | 0.3 | 8 |
| 2019 | 0.6 | 0.1 | 1.2 | 0.3 | 0.8 | 0.7 | 0.4 | 0.1 | 0.1 | 0.3 | 8 |
| 2020 | 0.7 | 0.1 | 1.2 | 0.3 | 0.8 | 0.9 | 0.3 | 0 | 0.1 | 0.2 | 8 |
| 2021 | 0.6 | 0.1 | 1 | 0.2 | 0.9 | 0.8 | 0.4 | 0 | 0.1 | 0.3 | 8 |
| 2022 | 0.6 | 0.1 | 1.1 | 0.3 | 0.9 | 0.8 | 0.4 | 0 | 0.1 | 0.5 | 8 |
| 2023 | 0.6 | 0.1 | 1.1 | 0.3 | 0.8 | 0.7 | 0.5 | 0 | 0.1 | 0.4 | 8 |
Source: Government of Alberta
Accessible chart description
Line chart showing the change over time in annual average SO2 concentrations for large urban centres in Alberta, the provincial average, and the 10th and 90th percentile of all SO2 monitoring stations in the province. The chart also displays the Alberta Ambient Air Quality Objective for annual average SO2 (8 ppb). Provincial average SO2 annual average concentrations and some large urban centres' concentrations (Calgary and Edmonton) have decreased since 2000. The Provincial Average of annual average SO2 concentrations was 1.3 ppb in 2000 and 0.6 ppb in 2023.
Figure 2b. Trends in peak SO2 concentrations from 2000 to 2023 at large population centres in Alberta
Chart data table
| Year | Provincial Average | 10th Percentile | 90th Percentile | Calgary | Edmonton | Fort McMurray | Grande Prairie | Lethbridge | Medicine Hat | Red Deer |
|---|---|---|---|---|---|---|---|---|---|---|
| 2000 | 33.2 | 12.5 | 73.8 | 20 | 33 | 28 | 11 | |||
| 2001 | 37.8 | 8.6 | 90.8 | 30 | 32 | 40.5 | 9 | |||
| 2002 | 38.6 | 7 | 94 | 16 | 31 | 43.5 | 7 | |||
| 2003 | 50.3 | 11.8 | 119 | 14 | 28 | 33.5 | 5 | |||
| 2004 | 56.3 | 10.2 | 112.6 | 13 | 26 | 52 | 6 | 4 | ||
| 2005 | 50.8 | 8 | 100 | 14 | 24 | 49 | 7.7 | 4 | 5 | |
| 2006 | 43.7 | 11.3 | 103 | 12 | 33 | 26.5 | 11.2 | 5 | 6 | |
| 2007 | 36.7 | 8.7 | 81.3 | 9 | 24 | 42 | 7.9 | 3 | 4 | |
| 2008 | 38.7 | 8.8 | 82.2 | 10.7 | 24 | 39 | 9.2 | 4 | 9 | |
| 2009 | 30.6 | 5.6 | 68.7 | 12 | 25 | 34 | 4.9 | 5 | 7.2 | |
| 2010 | 35.3 | 5.4 | 68.6 | 8.3 | 20 | 38.5 | 6.7 | 6 | 7.1 | |
| 2011 | 32.4 | 5.2 | 61.6 | 23 | 26.5 | 5.6 | 5 | 5 | ||
| 2012 | 29.2 | 4.4 | 66.6 | 25 | 27 | 5 | 3 | 4 | 2.1 | |
| 2013 | 29 | 4.5 | 59 | 20.5 | 36.5 | 5 | 4 | 4 | 3 | |
| 2014 | 27.9 | 5.5 | 49 | 26 | 26 | 5 | 7 | 4 | 2 | |
| 2015 | 26.4 | 4 | 42.8 | 7 | 19.5 | 23 | 5 | 4 | 4 | 3.5 |
| 2016 | 30 | 4.3 | 51.4 | 5 | 23 | 32 | 14 | 2 | 4 | 4.5 |
| 2017 | 27.4 | 4 | 59.5 | 6 | 29 | 25.5 | 7 | 2 | 3 | 5.5 |
| 2018 | 19.7 | 3.9 | 36.2 | 8 | 26 | 25 | 6.7 | 2 | 2 | 5.5 |
| 2019 | 19 | 4 | 38.4 | 5 | 23.8 | 20.5 | 24 | 2 | 4 | 4.2 |
| 2020 | 22.1 | 4 | 62.1 | 3.8 | 21.4 | 39 | 11.5 | 2 | 4.5 | 4.7 |
| 2021 | 21.1 | 3.2 | 39.6 | 4.7 | 24.2 | 21.5 | 26.4 | 2 | 2.7 | 5.2 |
| 2022 | 22.4 | 3.2 | 51.7 | 5.3 | 30.2 | 24.9 | 19 | 2 | 3.3 | 5.2 |
| 2023 | 20.7 | 3 | 39.1 | 4.3 | 26.3 | 23.5 | 17.3 | 1 | 1.4 | 6 |
Source: Government of Alberta
Accessible chart description
Line chart showing the change over time in peak SO2 concentrations for large urban centres in Alberta, the provincial average, and the 10th and 90th percentile of all SO2 monitoring stations in the province. Provincial average SO2 peak concentrations and some large urban centres' concentrations (Calgary and Fort McMurray) have decreased since 2000. The Provincial Average of peak SO2 concentrations was 33.2 ppb in 2000 and 20.7 ppb in 2023.
- Statistically significant decreasing trends in annual average and peak SO2 were also detected at stations located near industrial facilities since 2000 (Figures 3a and 3b, respectively). This decrease is due to improved emissions control technology and practices at industrial facilities.
Figure 3a. Trends in annual average SO2 concentration from 2000 to 2023 by station classification
Chart data table
| Year | Provincial Average | 10th Percentile | 90th Percentile | Community | Near Industrial Facility | Regional | AAAQO |
|---|---|---|---|---|---|---|---|
| 2000 | 1.3 | 0.6 | 2.3 | 1.2 | 1.8 | 1.1 | 8 |
| 2001 | 1.2 | 0.3 | 2.5 | 1.2 | 2 | 0.8 | 8 |
| 2002 | 1.3 | 0.4 | 2.2 | 1.1 | 2 | 0.7 | 8 |
| 2003 | 1.4 | 0.5 | 2.4 | 1 | 2.4 | 0.9 | 8 |
| 2004 | 1.4 | 0.5 | 2.5 | 0.9 | 2.6 | 0.9 | 8 |
| 2005 | 1.3 | 0.4 | 2.2 | 0.9 | 2.2 | 1 | 8 |
| 2006 | 1.2 | 0.4 | 2.5 | 0.7 | 2.1 | 1 | 8 |
| 2007 | 1 | 0.4 | 2.1 | 0.7 | 2 | 0.9 | 8 |
| 2008 | 1 | 0.3 | 1.9 | 0.7 | 1.9 | 0.8 | 8 |
| 2009 | 0.9 | 0.3 | 1.8 | 0.7 | 1.5 | 0.7 | 8 |
| 2010 | 0.8 | 0.2 | 1.4 | 0.6 | 1.7 | 0.5 | 8 |
| 2011 | 0.8 | 0.2 | 1.6 | 0.7 | 1.6 | 0.5 | 8 |
| 2012 | 0.7 | 0.2 | 1.3 | 0.5 | 1.3 | 0.5 | 8 |
| 2013 | 0.8 | 0.2 | 1.3 | 0.6 | 1.3 | 0.6 | 8 |
| 2014 | 0.8 | 0.2 | 1.4 | 0.6 | 1.4 | 0.5 | 8 |
| 2015 | 0.7 | 0.1 | 1.1 | 0.5 | 1.5 | 0.5 | 8 |
| 2016 | 0.7 | 0.1 | 1.3 | 0.5 | 1.6 | 0.4 | 8 |
| 2017 | 0.6 | 0.1 | 1.1 | 0.5 | 1.1 | 0.5 | 8 |
| 2018 | 0.5 | 0.1 | 1 | 0.5 | 0.9 | 0.5 | 8 |
| 2019 | 0.6 | 0.1 | 1.2 | 0.5 | 0.9 | 0.4 | 8 |
| 2020 | 0.7 | 0.1 | 1.2 | 0.5 | 1.4 | 0.5 | 8 |
| 2021 | 0.6 | 0.1 | 1 | 0.5 | 1.1 | 0.5 | 8 |
| 2022 | 0.6 | 0.1 | 1.1 | 0.6 | 1 | 0.4 | 8 |
| 2023 | 0.6 | 0.1 | 1.1 | 0.5 | 1 | 0.4 | 8 |
Source: Government of Alberta
Accessible chart description
Line chart showing the change over time in annual average SO2 concentrations in Alberta by station classification, as well as the provincial average and the 10th and 90th percentile of all SO2 monitoring stations in the province. Three station classifications are shown: Community, Near Industrial Facility, and Regional. All three station classification annual average concentrations have remained below 3 ppb since 2000. The chart also displays the Alberta Ambient Air Quality Objective for annual average SO2 (8 ppb).
Figure 3b. Trends in peak SO2 concentrations from 2000 to 2023 by station classification
Chart data table
| Year | Provincial Average | 10th Percentile | 90th Percentile | Community | Near Industrial Facility | Regional |
|---|---|---|---|---|---|---|
| 2000 | 33.2 | 12.5 | 73.8 | 22.5 | 78.3 | 20.3 |
| 2001 | 37.8 | 8.6 | 90.8 | 29 | 85.8 | 11 |
| 2002 | 38.6 | 7 | 94 | 23.9 | 83.7 | 15.8 |
| 2003 | 50.3 | 11.8 | 119 | 27.3 | 109.6 | 27.3 |
| 2004 | 56.3 | 10.2 | 112.6 | 26.7 | 122.6 | 31.3 |
| 2005 | 50.8 | 8 | 100 | 25.2 | 114 | 33.4 |
| 2006 | 43.7 | 11.3 | 103 | 22 | 98.1 | 30.1 |
| 2007 | 36.7 | 8.7 | 81.3 | 20.4 | 82.4 | 24.7 |
| 2008 | 38.7 | 8.8 | 82.2 | 20.4 | 88.6 | 24.1 |
| 2009 | 30.6 | 5.6 | 68.7 | 18.3 | 66 | 21 |
| 2010 | 35.3 | 5.4 | 68.6 | 18 | 88 | 18.6 |
| 2011 | 32.4 | 5.2 | 61.6 | 18.5 | 77 | 17.4 |
| 2012 | 29.2 | 4.4 | 66.6 | 18.7 | 62.6 | 18 |
| 2013 | 29 | 4.5 | 59 | 18 | 60.6 | 17.8 |
| 2014 | 27.9 | 5.5 | 49 | 15.5 | 63.4 | 18.2 |
| 2015 | 26.4 | 4 | 42.8 | 13 | 61.5 | 21.4 |
| 2016 | 30 | 4.3 | 51.4 | 17 | 77.2 | 15.8 |
| 2017 | 27.4 | 4 | 59.5 | 16.6 | 67.4 | 18.4 |
| 2018 | 19.7 | 3.9 | 36.2 | 16.1 | 38.2 | 15.8 |
| 2019 | 19 | 4 | 38.4 | 16.1 | 34.6 | 13.5 |
| 2020 | 22.1 | 4 | 62.1 | 17.7 | 45.7 | 14.3 |
| 2021 | 21.1 | 3.2 | 39.6 | 16.2 | 42.8 | 13.6 |
| 2022 | 22.4 | 3.2 | 51.7 | 20.7 | 37.7 | 13.2 |
| 2023 | 20.7 | 3 | 39.1 | 16.2 | 39.6 | 11.9 |
Source: Government of Alberta
Accessible chart description
Line chart showing the change over time in peak SO2 concentrations in Alberta by station classification, as well as the provincial average and the 10th and 90th percentile of all SO2 monitoring stations in the province. Three station classifications are shown: Community, Near Industrial Facility, and Regional. The Community and Regional station averages have remained below 40 ppb since 2000. Near Industrial Facility stations have decreased from 78.3 ppb in 2000 to 39.6 ppb in 2023, with a peak in 2004 (with a peak value of 122.6 ppb).
- Examining the trends over more recent years and for all stations across the province provides additional information on the changes over time for the indicator. Between 2014 and 2023, 6 out of 38 stations meeting data completeness criteria had statistically significant increasing trends in monthly average SO2. These stations include Fort Chipewyan, Cold Lake South and Tamarack, located near industrial facilities in the Lower Athabasca Region, where SO2 levels are managed through Alberta’s regulatory system and the Lower Athabasca Regional Plan. The other 3 stations with increasing trends in monthly average SO2 are community monitoring stations located in northwest and central Alberta (Beaverlodge, Grande Prairie, and Red Deer-Riverside).
Comparison to provincial objectives
- Alberta's Ambient Air Quality Objectives provide thresholds for over 30 airborne compounds to protect human and ecosystem health. The AAAQOs are used in the design of industrial facilities and to establish emissions requirements. The Alberta government tracks AAAQO exceedances and assesses the need for management action.
- Figure 2a shows that between 2000 and 2023, annual average concentrations of SO2 were well below the annual AAAQO throughout Alberta. The annual AAAQO of 8.0 parts per billion (ppb) for SO2 is based on the protection of ecosystems.
- In 2023, there were 8 exceedances of the one-hour AAAQO. These exceedances occurred at Lower Camp (2 exceedances) and Mannix (6 exceedances) stations, located near industrial facilities in northeastern Alberta. Historically, exceedances of the one-hour AAAQO have been observed at stations near industrial facilities known to emit SO2 in the oil sands region and the industrial heartland northeast of Edmonton. The one-hour AAAQO of 172 ppb for SO2 is based on the protection of human health.
Air quality reporting and resources
- Alberta reports annually on the status of air quality for existing regional air quality management frameworks (AQMFs) as well as the Canadian Ambient Air Quality Standards (CAAQS).
- SO2 is one of the pollutants reported on through the Lower Athabasca Region (LAR) AQMF as well as the CAAQS.
- The most recent assessment results are available in Alberta’s Air Zone Reports.
- Published reports and scientific papers on air quality in Alberta are available via the Air Indicators landing page under ‘Related Publications’.
- Alberta also provides air quality data and information to the public through the near real-time AQHI website and provides access to quality assured data via Alberta’s Air Data Warehouse.
Focused study
Alberta investigated concentrations of SO2 in the oil sands region as part of the management response under the Air Quality Management Framework for the Lower Athabasca Region.
- SO2 concentrations at several stations in the Lower Athabasca Region (Lower Camp, Mannix, Mildred Lake, and Christina Lake) exceeded the Level 3 and Level 4 triggers for the upper range of hourly data (calculated as the 99th percentile) over the period from 2016 to 2021 (Figure 4) (see the Status of Air Quality in Alberta: Air Zones report 2019-2021).
- The relationships between SO2 and weather conditions, such as wind-speed and wind direction, and hydrogen sulphide (H2S) were explored.
- The characteristics of the elevated SO2 episodes suggest nearby industrial operations as the major contributing sources at each station.
- This work is part of a broader investigation in the Lower Athabasca Regional Plan Management Response.
Figure 4. Upper range of hourly data for SO2 at select stations in the Lower Athabasca Region from 2016 to 2021.
Chart data table
| Year | Christina Lake | Lower Camp | Mannix | Mildred Lake | Level 2 | Level 3 | Level 4 |
|---|---|---|---|---|---|---|---|
| 2016 | 43 | 36 | 29 | 12 | 24 | 36 | |
| 2017 | 42 | 35 | 27 | 12 | 24 | 36 | |
| 2018 | 30 | 24 | 22 | 12 | 24 | 36 | |
| 2019 | 24 | 26 | 23 | 15 | 12 | 24 | 36 |
| 2020 | 35 | 32 | 39 | 33 | 12 | 24 | 36 |
| 2021 | 24 | 28 | 25 | 27 | 12 | 24 | 36 |
Table description
Bar chart showing the upper range SO2 concentrations for Christina Lake, Lower Camp, Mannix, and Mildred Lake stations from 2016 to 2021. The Lower Athabasca Region Air Quality Management Framework triggers for Level 2, Level 3, and Level 4 are shown as horizontal lines.The Lower Camp station had the highest SO2 upper range concentrations in 2016 and 2017 (values of 43 ppb and 42 ppb, respectively) and exceeded the Level 4 trigger (36 ppb) in these years. SO2 levels at the Lower Camp station in subsequent years (2018 to 2021) were less than the Lever 4 trigger (with values ranging from 26 ppb to 32 ppb). The Mannix station exceeded the Level 4 trigger in 2020 (with an upper range concentration of 39 ppb) and was above the Level 3 trigger in 2016, 2017, and 2021. The Mildred Lake station had concentrations ranging from 15 ppb in 2019 to 33 ppb in 2020. The Christina Lake station had concentrations ranging from 24 ppb in 2019 and 2021 to 35 ppb in 2020.