Non-urgent government operations are closed December 24 to January 1, reopening January 2. See the list of services available during this time.
The Alberta Activity Index was updated on November 29, 2024 to include September 2024 data.
Highlights
Activity eased but remained elevated
- The Alberta Activity Index (AAX) continued to ease in September.
- The index edged down 0.1% month-over-month (m/m) due to a moderation of activity in the energy and business sectors.
- The energy sector moved down with oil production retreating from recent highs as facilities underwent maintenance.
- Business sector activity fell due to ongoing weakness in manufacturing sales that overwhelmed a rebound in wholesale trade.
- Conversely, household sector activity expanded, supported by robust retail sales.
- The labour market continued to advance with higher earnings, although employment moderated.
- Despite inching down in the month, the AAX is up 1.8% year-over-year (y/y) and 2.0% year-to-date (YTD).
Data table
View the Alberta Activity Index Data Table to find monthly data points for January 1981 to September 2024.
Year-over-year change
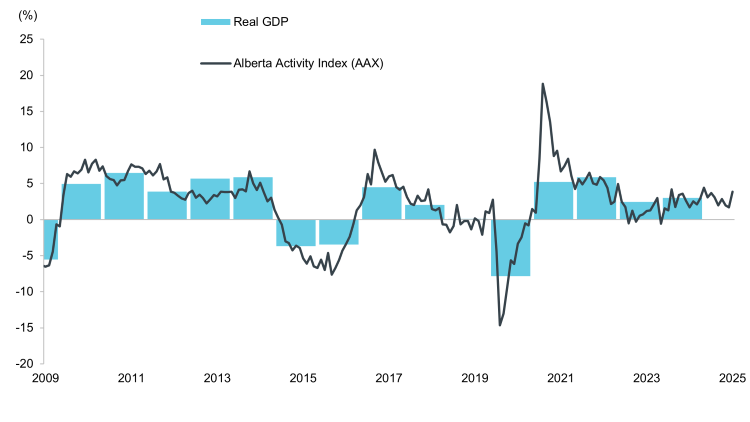
The following chart shows year-over-year change in the Alberta Activity Index and real GDP from 2004 to September 2024.

Alberta Activity Index indicators
Developed by Alberta Treasury Board and Finance, the AAX is a weighted average of 9 monthly indicators:
- employment
- average weekly earnings
- retail trade
- wholesale trade
- manufacturing shipments
- new truck sales
- housing starts
- rigs drilling
- oil production
For more information on the AAX, see "Introducing the Alberta Activity Index" from the April 2017 Economic Trends.
Sign up for updates
Subscribe to get our economic publications by email
Contact
Asrafuzzaman, Economist
Alberta Treasury Board and Finance
Phone: 780-427-8659
Toll free: 310-0000 before the phone number (in Alberta)
Email: [email protected]